
Unsupervised Learning, as clearly defined through its name, uses no classification or labelled information as input to the algorithm. In stark contrast to supervised learning, the machine learns all by itself with no teacher for guidance (An extraordinary student, one would say). Here, algorithm tries to look for hidden patterns in the data set. The objective is to identify group of similar objects using similarities, differences or patterns without any other added information.
For example, if machine wants to differentiate between fishes and birds. If we do not tell the machine which animal is a fish and which is a bird (that is until we do not label them) machine will have to differentiate them by using similarities or patterns found in their attributes.

Unsupervised Learning can be categorized into two types:
- Clustering – In clustering we try to find the inherent groupings in the data, such as grouping customers by purchasing behavior.
- Association: In association we try to find patterns that describe large portions of our data, such as people that buy X also tend to buy Y.
K-Means Clustering (also known as Lloyd’s algorithm) is a one of the most used and simplest form of Cluster Analysis. We all know the problems that are created by propagation of fake news in any country but did you know with the help of K-Means Clustering we can predict which news is fake and which is real?
There was a research conducted by two students from University of California on the same. Not only this, K-Means clustering has a wide variety of use cases in insurance fraud detection, document classification, segmentation of customers and many more. In this blog we will go through what is K-Means Clustering and how is it can be performed in R using a simple data set. Let us first understand what Clustering is all about.
Clustering
In simple terms, Clustering is grouping of similar objects, keeping in mind that objects of one cluster are similar to one another while objects of two different clusters differ from each other.
Clustering can broadly be categorized in many different ways. Some broadly categories clustering into two parts:
- Hard Clustering – Here, one object is part of a single cluster. For eg. In K-Means Algorithm.
- Soft Clustering – One object can be part of multiple clusters. For eg. Fuzzy C-Means. Here membership of an object to different clusters is explained in terms of probability.
Clustering can also be categorized into:
- Hierarchial Clustering : In this method, individual data points are taken as clusters then nearby clusters are joined one by one to make one big cluster. It can further be divided into two types, Agglomerative and Divisive.
- Partioning Clustering : In this method, ‘K’ the number of clusters need to be defined beforehand. Data points shift from one cluster to another in multiple iterations before getting fixed to one cluster. Partioning consists of K-Means clustering and fuzzy C clustering.
- Density Based Clustering : High density areas are taken into a cluster allowing for arbritarily shaped clusters.
- Grid Based Clustering : The grid-based clustering approach differs from the conventional clustering algorithms in that it is concerned not with the data points but with the value space that surrounds the data points.
- Model–based clustering : Assumes that the data was generated by a model and tries to recover the original model from the data
For a more detailed study on various type of clustering algorithms, Click Here.

HISTORY BEHIND K-MEANS
In this blog, we are going to study about one of the most popular algorithm for clustering which is K-Means Clustering. The term K-Means was first used by James MacQueen in 1967 and the algorithm was first proposed by Stuart Lloyd in 1957 as a technique for pulse code modulation. In simple terms, K-Means is an iterative algorithm that tries to cluster data into “k” number of clusters with similar attributes.
STEPS FOLLOWED IN K-MEANS CLUSTERING
Let us first learn what K-Means Clustering is all about through some steps:
Round 1: To perform K-means clustering on a data set we first give the value of “k” (the number of clusters). Let us assume here k = 2. Now the algorithm will arbitrary take two points to be the centroid for the 2 clusters. In illustration, one is marked with pink and another in blue. It then calculates the distance of other points from their centroids (Distance is calculated through Euclidean method which we will see later). We will assign the data point nearer to centroid number 1 into a Cluster A and points near centroid number 2 into 2nd Cluster B. Hence 2 clusters are formed. Here Cluster A is represented in Pink and Cluster B is represented in Blue.


Now let’s look at Round 2:
After the formation of clusters, again a centroid is chosen but this time it is not arbitarily positioned. Centroid of the clusters A and B are now calculated according to mean of distance of points in a cluster to the centroid of that cluster. To see how centroid is calculated with an example, Click Here. Now distance of data points from the new centroid C1 and C2 is calculated. In this some points which were a part of Cluster B earlier are now closer to centroid 1 than 2. Therefore these points become a part of Cluster A now.


Now in Round 3, again a reiteration of round 1 and 2 happens where new centroid is computed for both the clusters. Distance of the data points are calculated from the new centroids. Again there is a shift of data points, here it is from Cluster B to Cluster A and again 2 new clusters are formed. In this example this was the final round, as there was no shift of data points from one cluster to another after this but in large datasets, things might differ.


Flowchart of the steps

WAYS TO CALCULATE DISTANCE
There are multiple ways in which we can calculate this distance of data points from the centroid. Such as euclidean, maximum( Chebychev Distance), manhattan, hamming, canberra, pearson , abspearson , abscorrelation, spearman or kendall.
Most used distance format is the Euclidean distance. It is the default type for distance as it gives straight line distance between two points in 2D. Formulas of other distance measures and how they differ from euclidean has been given below.


To know more about various ways of calculating distances, please refer to this link. Mostly Euclidian method is used as even the concept of centroid is generated from Euclidean geometry, giving the best results.
OPTIMAL VALUE OF K
Now comes the question how do we decipher the number of clusters required in a dataset. It can be a problem if we take less number of clusters and similarly it can be a problem if we take too many clusters. The trade off is between accuracy and overfitting.
Let me explain this with an example:
In the first figure, only two cluster are taken. Here the issue becomes that the distance of data points from the centroid is too large. The accuracy of the model, grouping the data points which are similar to the each other in the same cluster, is too low.
too few clusters

In the second image, there are three clusters which seems just right according to the dataset that we have taken.
just the right number of clusters

Now if we try to increase the number of clusters to four, it does not give a significant difference from the second image in terms of reduction of distance of data points from the centroid. Also it can now create a problem of overfitting the model.
too many clusters

Here comes the Elbow method which show that the average distance from the centroid decreases till an optimal point and after a certain point dividing dataset into more number of clusters does not give optimal results. This optimal point K is taken as the number of cluster for that particular dataset. We will further see it in details later in the blog.

USE CASE
Let us work all this theory out with a practical example:
Now about our dataset: We have data of customers at mall including their customer id, age, gender, annual income and spending score. Our objective here is to segment our dataset into different categories of customers based on some similar attributes. You can easily download the dataset for practice from Kaggle. Our dataset consists of 200 records and 5 columns. We will be using only two of these namely, Annual Income and Spending Score.

Through this code, we will be able to find out about clusters of different customers, according to their income and their spending. Here we will be able to segment the data and find the cluster that will be profitable to us i.e our target customers.
library(readr)
data <- read_csv("C:/Users/HP/Downloads/Mall_Customers.csv")
View(data)
x<-data[4:5]   ##Here we take only Column number 4 and 5 for analysis.
After this we calculate the optimum number of clusters that we should divide the dataset in. This we can do with the help of Elbow Method. The code for the same and the explanation is given below. Here, WCSS stands for within cluster sum of square. By default K-Means uses Hartigan-Wong algorithm for K-Means calculations with the following formula to calculate the distance. In simpler terms, wcss measures the distance of points from the centroids , squares it and then does the same for all the clusters and then add them together. Lesser the sum (or wcss) better is the compactness of he clusters, better is the model.

Given n objects with p variables measured on each object x(i,j) for i = 1,2,…,n; j = 1,2,…,p; K-means allocates each object to one of K groups or clusters to minimize the within-cluster sum of squares.

where the arguments are:
- x: A numeric matrix of data, or an object that can be coerced to such a matrix (such as a numeric vector or a data frame with all numeric columns).
- centers: Either the number of clusters or a set of initial (distinct) cluster centers. If a number, a random set of (distinct) rows in x is chosen as the initial centers.
- iter.max: The maximum number of iterations allowed.
- nstart: If centers is a number, nstart gives the number of random sets that should be chosen.
- algorithm: The algorithm to be used. It should be one of “Hartigan-Wong”, “Lloyd”, “Forgy” or “MacQueen”. If no algorithm is specified, the algorithm of Hartigan and Wong is used by default.
If everything goes OK, an object of class kmeans is returned. This object has the following components:
- cluster: A vector of integers indicating the cluster to which each point is allocated.
- centers: A matrix of cluster centers.
- whithnss: The within-cluster sum of squares for each cluster.
- size: The number of points in each cluster.
Here wcss is taken as vector on which a for loop is applied for i ranging from 1 to 10 (which signifies the number of clusters). WCSS is there to measure the compactness of the clusters. It means that the WCSS (within cluster sum of squares will be calculated for when K (number of cluster) is 1 to when K is 10. Here in loop i is representing the same.
set.seed(6)       #used to randomize the result produced
wcss <- vector()
for (i in 1:10) wcss[i] <- sum(kmeans(x, i)$withinss) #this will help find wcss for each k from 1-10
plot(1:10, wcss, type = 'b', main = paste('Clusters of Clients'), xlab = 'Number of Clusters', ylab = 'WCSS')
USE OF ELBOW METHOD
This method involves running the algorithm with multiple values of K and finding out the best possible vale of K. The graph here looks like an elbow as after a point increasing the value of K does not increase the efficiency.
The x- axis consists of the number of clusters and the y-axis consists of the sum of square distances from each point to its assigned center. WCSS stands for within cluster sum of squrare. As we can see from the output that when we take k=5 then the distance is relatively less but after 5 the distance does not decrease significantly. The rule is basically to choose the point from where the plot starts decreasing linearly. Therefore we take k= 5 for our dataset.

Drawbacks of Elbow Method is that it is confusing if the data is not very clustered. A little ambiguity on which K should be taken. Here Silhouette score and BIC score with a gaussian mixture model are said to be more efficient.
SILHOUETTE ANALYSIS
Silhouette method gives a clear answer of the value of K, unlike Elbow method.Let us try silhouette method with our dataset:
silhouette_score <- function(k){
  km <- kmeans(x, centers = k, nstart=25)
  ss <- silhouette(km$cluster, dist(x))  #Using silhouette function in cluster library
  mean(ss[, 3])
}
k <- 2:10
avgsil <- sapply(k, silhouette_score)   #calculating avg silhouette score for diff k
plot(k, type='b', avgsil, xlab='Number of clusters', ylab='Average Silhouette Scores', frame=FALSE)

The average silhouette method computes the average silhouette of observations for different values of k (here from 2 to 10). The optimal number of clusters k is the one that maximizes the average silhouette score over a range of possible values for k. Here optimal value of k (clearly seen through the graph) is 5.
Now let us apply the K-Means algorithm to x, here iter.max is taken as 300 which gives the maximum number of times the iterations will takes place i.e moving centroids and clusters in data points into convergence. Nstart will give the number of times initial datapoints will be sampled. Clusplot will give a bivariate cluster plot to help visualize our k-means algorithm.
set.seed(29)
kmeans <- kmeans(x, 5, iter.max = 300, nstart = 10)
library(cluster)
clusplot(x,
         kmeans$cluster,
         lines = 0,
         shade = TRUE,
         labels = 2,
         plotchar = FALSE,
         span = TRUE,
         main = paste('Clusters of Clients'),
         xlab = 'Annual Income',
         ylab = 'Spending Score')
ANALYSIS
From this code I get the output of 5 clusters formed on the basis of spending score and annual income. These can be analysed to understand which one can be our target customers.
- The cluster with low spending score and low income are the people who are rational with their spending.
- The people with high spending and high income are the ones who have the capability to buy and can be your target customers depending on the product.
- Then there is a cluster that represents high income and low spending, these people are careful with the amount they spend.
- The people with low income and high spending are not careful with the amount they spend and so they can be dangerous to have as a customer specially if the product is taken on a credit basis.
- Then there are also people with mid-level income and mid spending score, they form a standard group of people that may or may not be your target customers
OUTPUT

PUTTING IT INTO MOTION
library(animation)                                    #using R library for animation
ani.options(interval=1)                   #interval signifies the speed of animation
kmeans.ani(x,centers=5,pch=1:5,col=1:5)

Iteration in K-Means clustering through R
PROBLEMS WITH K-MEANS
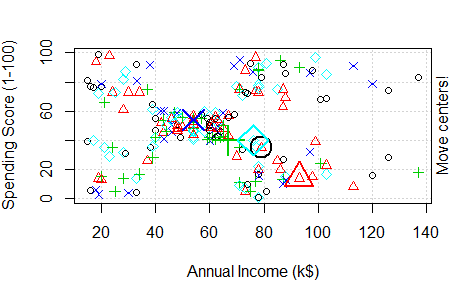
RANDOM INITIALIZATION TRAP
As at the start of the algorithm centroids are randomly assigned. It is possible that the centroids be assigned in such an arbritary way that the model is not able to form the right clusters. Looking at the illustration, the first image shows how the clusters were supposed to be made and how centroid could be rightly placed even when random.

This second image shows how a bad initialization can lead to formation of the wrong clusters.

Here use of K-Means++ can help avoid bad initialization.
- Another big disadvantage of k-means is have to choose the number of clusters, if not selected correctly it can ruin the whole model.
- Can only be applied if mean of cluster defined. It will not work for categorical data.
- Since mean is used, algorithm will be sensitive to outliers in the dataset. Outliers can vary the mean significantly. Here K-medoids can be used as a solution. Instead of mean of a cluster, median of cluster is taken. Click Here to read more about it.
SUMMARY:
library(readr)
data <- read_csv("C:/Users/HP/Downloads/Mall_Customers.csv")
View(data)
x<-data[4:5]   ##Here we take only Column number 4 and 5 for analysis.
set.seed(6)       #used to randomize the result produced
wcss <- vector()
for (i in 1:10) wcss[i] <- sum(kmeans(x, i)$withinss) #this will help find wcss for each k from 1-10
plot(1:10, wcss, type = 'b', main = paste('Clusters of Clients'), xlab = 'Number of Clusters', ylab = 'WCSS')
silhouette_score <- function(k){
  km <- kmeans(x, centers = k, nstart=25)
  ss <- silhouette(km$cluster, dist(x))  #Using silhouette function in cluster library
  mean(ss[, 3])
}
k <- 2:10
avgsil <- sapply(k, silhouette_score)   #calculating avg silhouette score for diff k
plot(k, type='b', avgsil, xlab='Number of clusters', ylab='Average Silhouette Scores', frame=FALSE)
set.seed(29)
kmeans <- kmeans(x, 5, iter.max = 300, nstart = 10)
library(cluster)
clusplot(x,
         kmeans$cluster,
         lines = 0,
         shade = TRUE,
         labels = 2,
         plotchar = FALSE,
         span = TRUE,
         main = paste('Clusters of Clients'),
         xlab = 'Annual Income',
         ylab = 'Spending Score')
library(animation)                                    #using R library for animation
ani.options(interval=1)                   #interval signifies the speed of animation
kmeans.ani(x,centers=5,pch=1:5,col=1:5)
ADVANTAGE OF K-MEANS:
- Includes being able to work on a large dataset.
- Easy to adapt
- Scalable and efficient.
This is all about K-Means. In the next blog we will be going through another different type of Clustering model.
ADDITIONAL READINGS:
Research Paper : snap.stanford.edu/mis2/files/MIS2_paper_2.pdf
To read about Silhouette Analysis in Python : https://scikit-learn.org/stable/auto_examples/cluster/plot_kmeans_silhouette_analysis.html
To read about K-Mediods with an example : https://www.geeksforgeeks.org/ml-k-medoids-clustering-with-example/
Advantages of careful seeding (K-Means ++) Stanford Research Paper : http://ilpubs.stanford.edu:8090/778/1/2006-13.pdf
K-Means Clustering in Python : https://heartbeat.fritz.ai/k-means-clustering-using-sklearn-and-python-4a054d67b187

Great work Shatakshi!
This article is so easy to comprehend even for someone with almost negligible knowledge in this domain. The way K means clustering has been explained in this article, has developed interest in me to explore more about it.
LikeLike
Well explained!
LikeLike
Really helpful and well explained.
LikeLike